PublicMind Polling, Surveys, Market Analysis
Loading
For Immediate Release … Tuesday, January 28, 2014 6 pp.
Contact: Krista Jenkins 908.328.8967 (cell) or 973.443.8390 (office); kjenkins@fdu.edu
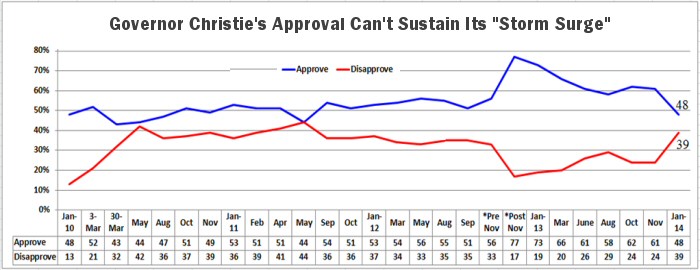
The historically high approval ratings enjoyed by Governor Christie in the wake of Hurricane Sandy have taken a considerable hit in the days following the George Washington Bridge lane closure revelations. A new statewide poll of registered voters from Fairleigh Dickinson University’s PublicMind finds the governor’s job approval is down by double digits from October 2013, the last time the question was asked, and the percentage of those who dislike the governor has increased considerably.
Right now, 48 percent of respondents say they approve of the job he’s doing as governor, with 39 percent who say they disapprove. In October, the last time the same question was asked, 62 percent gave the governor high marks, a number that was virtually unchanged from those reported in the months after Hurricane Sandy. The last time the governor’s job approval dipped below the 50 percent mark was back in May 2011.
“The allegations of malicious politicking in his administration are taking their toll,” said Krista Jenkins, director of PublicMind and professor of political science at Fairleigh Dickinson University. “His declining approval comes at an inopportune time. His entrance on the national stage as head of the Republican Governor’s Association, and possible presidential contender for 2016, complicates his introduction to a national electorate.”
Christie Approval - Trend
The percentage of those who like the governor and his policies has fallen as well. When voters were asked whether they like the governor and his policies, like him but not his policies, dislike him but like his policies, or dislike everything about him, 27 percent say they dislike everything about the governor, higher than the 18 percent observed in October when the same question was last asked. Back then, 46 percent said they liked the governor and his policies, while today that number has dropped to 38 percent.
Democrats and independents, coveted demographics needed for the governor to maintain his bipartisan credibility, are among those who have soured the most on the governor’s leadership. In October, 47 percent of Democrats and 60 percent of independents approved of his job performance. Today those numbers have dropped to 34 and 41 percent, respectively.
A similar trend appears on the question of whether registered voters like or dislike the governor. Right now, 21 percent of Democrats and 29 percent of independents like the governor personally and his politics, whereas in the fall the same groups liked everything about the governor considerably more (28 and 40 percent, respectively). These same groups register higher disapprovals for the governor today, with 42 percent of Democrats and 26 percent of independents disliking everything about the governor. These are up from the 28 and 20 percent of the same groups, respectively, in October 2013.
“Although the governor still has a good amount of support among those who aren’t his natural allies, the political lovefest that often defined his relationship with Democrats seems to have cooled,” said Jenkins. “Of course, this is just a snapshot, and as information about what went on in the various inquiries that are driving news of the Christie administration continues to become available, these numbers could improve. But, at least today, the frosty weather outside is an apt metaphor for the cooling that’s apparent in these numbers.”
Turning specifically to “Bridgegate” and whether Governor Christie was aware of the lane closures before emails and texts were made public, most respondents don’t believe his declared ignorance. Over half (53%) believe it’s unlikely that he did not know about the closures on the heavily trafficked bridge in advance. Overall suspicion of the governor’s claim that he didn’t know is fairly constant across key demographics. Around half or more of Democrats, independents, and Republicans, as well as men and women, and whites and non-whites say it’s unlikely that the governor knew nothing before documents were revealed publicly.
“A defining characteristic of the governor has been the public’s perception that he can be relied upon to speak honestly about issues that are both easy and difficult. At least on this issue, the public seems to be saying that, on balance, there’s more to the story than he’s so far revealed,” said Jenkins.
More than eight-in-ten (85%) registered voters say they’re following the GWB lane closure controversy closely. Partisans of all stripes are following the news about political machinations in Trenton to about the same degree, as are men and women, and whites and non-whites.
“With this degree of attentiveness, it would be hard for any politician to maintain strong support, particularly in a state with a preponderance of voters who don’t share the governor’s partisan leanings,” said Jenkins.
Finally, respondents were asked about a proposal the governor made in last week’s State of the State address. His proposal to lengthen the school day and year in order to improve the quality of K-12 education in the state is not being met with widespread public support. About one-in-five (19%) say doing so would greatly improve educational quality. However, more than double that number (41%) say a longer school day and year would do nothing to bring about educational improvements.
The Fairleigh Dickinson University poll of 734 registered voters in New Jersey was conducted by telephone with both landline and cell phones from January 20 through January 26 and has a margin of error of +/-3.6 percentage points.
Methodology, questions, and tables on the web at: http://publicmind.fdu.edu
Radio actualities at 201.692.2846 For more information, please call 201.692.7032
Methodology
The most recent survey by Fairleigh Dickinson University’s PublicMind was conducted by telephone from January 20 through January 26 using a randomly selected sample of 734 registered voters who reside in New Jersey. One can be 95 percent confident that the error attributable to sampling has a range of +/- 3.6 percentage points. The margin of error for subgroups is larger and varies by the size of that subgroup. Survey results are also subject to non-sampling error. This kind of error, which cannot be measured, arises from a number of factors including, but not limited to, non-response (eligible individuals refusing to be interviewed), question wording, the order in which questions are asked, and variations among interviewers.
PublicMind interviews are conducted by Opinion America of Cedar Knolls, NJ, with professionally trained interviewers using a CATI (Computer Assisted Telephone Interviewing) system. Random selection >is achieved by computerized random-digit dialing. This technique gives every person with a landline phone number (including those with unlisted numbers) an equal chance of being selected.
Landline households are supplemented with a separate, randomly selected sample of cell-phone respondents interviewed in the same time frame. The total combined sample is mathematically weighted to match known demographics of age, race and gender.
Tables
|
Now thinking about New Jersey, do you approve or disapprove of the job Chris Christie is doing as governor?[Randomize approve/disapprove] |
||||||||
|
|
|
PID |
Gender |
Race |
||||
|
|
All |
Dem |
Ind |
Repub |
Male |
Female |
White |
Nonwhite |
|
Approve |
48% |
34 |
41 |
73 |
48 |
48 |
54 |
33 |
|
Disapprove |
39% |
54 |
40 |
18 |
41 |
38 |
36 |
47 |
|
Neither (vol) |
8% |
9 |
8 |
7 |
8 |
8 |
7 |
12 |
|
DK/Ref (vol) |
4% |
3 |
12 |
3 |
3 |
6 |
3 |
8 |
|
Now thinking about New Jersey, do you approve or disapprove of the job Chris Christie is doing as governor?[Randomize] |
||||||||
|
|
|
Believe governor |
Following closely |
|||||
|
|
All |
Very likely |
Somewhat likely |
Somewhat unlikely |
Very unlikely |
Very closely |
Somewhat closely |
Not at all closely |
|
Approve |
48% |
48 |
60 |
59 |
35 |
43 |
51 |
54 |
|
Disapprove |
39% |
44 |
25 |
30 |
55 |
46 |
35 |
36 |
|
Neither (vol) |
8% |
6 |
9 |
6 |
7 |
7 |
10 |
5 |
|
DK/Ref (vol) |
4% |
3 |
5 |
5 |
3 |
4 |
4 |
5 |
|
I’m going to read you four statements about Chris Christie. Please tell me which comes closest to your own views: 1) I like him, AND I like his policies; 2) I like him, BUT I don’t like his policies; 3) I don’t like him, BUT I like his policies;) I don’t like him, AND I don’t like his policies. |
||||||||
|
|
|
PID |
Gender |
Race |
||||
|
|
All |
Dem |
Ind |
Repub |
Male |
Female |
White |
Nonwhite |
|
Like him/like policies |
38% |
21 |
29 |
67 |
38 |
38 |
45 |
21 |
|
Like him/dislike policies |
16% |
19 |
26 |
8 |
17 |
16 |
12 |
28 |
|
Don’t like him/like policies |
13% |
13 |
15 |
13 |
14 |
12 |
13 |
14 |
|
Don’t like him/don’t like policies |
27% |
42 |
26 |
8 |
26 |
29 |
25 |
32 |
|
DK/Ref (vol) |
5% |
5 |
4 |
5 |
5 |
5 |
5 |
5 |
|
In your opinion, how likely or unlikely [rotate] is it that Governor Christie was unaware that his aides ordered the lane closures on the George Washington Bridge before emails and text messages were released publicly? |
||||||||||||
|
|
|
PID |
Gender |
Race |
GWB Attentiveness |
|||||||
|
|
All |
Dem |
Ind |
Repub |
Male |
Female |
White |
Nonwhite |
Very |
Somewhat |
Not at all |
|
|
Very likely |
24% |
22 |
24 |
29 |
23 |
26 |
25 |
23 |
33 |
20 |
15 |
|
|
Somewhat likely |
12% |
12 |
14 |
11 |
11 |
12 |
12 |
11 |
8 |
15 |
12 |
|
|
Somewhat unlikely |
21% |
19 |
20 |
25 |
22 |
20 |
23 |
20 |
17 |
25 |
21 |
|
|
Very unlikely |
32% |
39 |
28 |
24 |
34 |
30 |
31 |
33 |
39 |
28 |
27 |
|
|
DK/Ref (vol) |
11% |
9 |
13 |
13 |
11 |
13 |
10 |
14 |
4 |
12 |
27 |
|
|
|
How closely are you following the recent controversy over the September 2013 lane closures on the George Washington Bridge? |
|
||||||||||||||||
|
|
|
|
PID |
Gender |
Race |
|
||||||||||||
|
|
|
All |
Dem |
Ind |
Repub |
Male |
Female |
White |
Nonwhite |
|
||||||||
|
|
Very closely |
38% |
44 |
31 |
34 |
41 |
34 |
39 |
33 |
|
||||||||
|
|
Somewhat closely |
47% |
42 |
48 |
51 |
45 |
48 |
49 |
42 |
|
||||||||
|
|
Not at all closely |
15% |
14 |
19 |
14 |
14 |
17 |
11 |
25 |
|
||||||||
|
|
DK/Ref (vol) |
0 |
0 |
2 |
0 |
0 |
1 |
0 |
1 |
|
||||||||
|
The governor recently proposed extending the school day and shortening vacations for children in the K-12 system. How much, if at all, do you believe this would improve the quality of the education that children receive in New Jersey? Do you think it would improve it… |
||||||||||||||||||
|
|
|
PID |
Gender |
Race |
||||||||||||||
|
|
All |
Dem |
Ind |
Repub |
Male |
Female |
White |
Nonwhite |
||||||||||
|
A great deal |
19% |
15 |
20 |
22 |
19 |
18 |
17 |
23 |
||||||||||
|
Somewhat |
24% |
22 |
18 |
29 |
24 |
23 |
24 |
23 |
||||||||||
|
A little |
13% |
13 |
16 |
12 |
15 |
11 |
13 |
13 |
||||||||||
|
Not at all |
41% |
46 |
44 |
33 |
38 |
43 |
42 |
38 |
||||||||||
|
DK/Ref (vol) |
4% |
4 |
3 |
4 |
3 |
5 |
5 |
2 |
||||||||||
Exact Question Wording and Order
US1 and US2 withheld for future release
NJ1. Now thinking about New Jersey, do you approve or disapprove of the job Chris Christie is
doing as governor?
1 Approve
2 Disapprove
3 Neither or neutral (vol)
8 DK or both (vol)
9 Ref. (vol)
NJ2 withheld for future release
NJ3 I’m going to read you four statements about Chris Christie. Please tell me which comes closest to your own views: 1) I like him, AND I like his policies; 2) I like him, BUT I don’t like his policies; 3) I don’t like him, BUT I like his policies; 4) I don’t like him, AND I don’t like his policies.
RANDOMIZE BUT KEEP 1 AND 2, 3 AND 4 TOGETHER
1 I like him, AND I like his policies
2 I like him, BUT I don’t like his policies
3 I don’t like him, BUT I like his policies
4 I don’t like him, AND I don’t like his policies
8 DK (vol)
9 Refused (vol)
NJ4 How closely are you following the recent controversy over the September 2013 lane closures on the George Washington Bridge?
1 Very closely
2 Somewhat closely
3 Not at all closely
8 DK/Ref
NJ5 In your opinion, how likely or unlikely [rotate] is it that Governor Christie was unaware that his aides ordered the lane closures on the George Washington Bridge before emails and text messages were released publicly?
1 Very likely
2 Somewhat likely
3 Somewhat unlikely
4 Very unlikely
8 DK/Ref
NJ6 and NJ7 withheld for future release
NJ8 The governor recently proposed extending the school day and shortening vacations for children in the K-12 system. How much, if at all, do you believe this would improve the quality of the education that children receive in New Jersey? Do you think it would improve it…
1 A great deal
2 Somewhat
3 A little
4 None at all
Sample characteristics – Registered voters
Gender
|
Male |
49 |
|
Female |
51 |
Age
|
18-29 |
12 |
|
30-44 |
26 |
|
45-59 |
32 |
|
60+ |
28 |
|
Refused |
2 |
Race/Ethnicity
|
White |
69 |
|
Black/African-American |
13 |
|
Latino or Hispanic |
9 |
|
Asian |
5 |
|
Other/refused |
4 |
Public employee household
|
Yes |
25 |
|
No |
73 |
|
Unsure/refused |
2 |
Party identification
|
Democrat/Lean Democrat |
44 |
|
Independent/DK/refused |
23 |
|
Republican/Lean Republican |
33 |